Table of Contents
You just finished your NBME. You typed your wrong answer count into a calculator. A three-digit number appeared on your screen.
Now your brain is doing one of two things — spiraling because the number is lower than you wanted, or exhaling too quickly because it’s higher than expected. Both reactions are probably off, and both are worth examining before you do anything with that number.
This guide covers what NBME Step 2 CK score conversion actually is, what it isn’t, why most articles about it are already outdated, and how to use your scores intelligently rather than emotionally. We’ll work through every active CCSSA form (9 through 15), explain the math behind the predictions, and give you a practical framework that holds up under real exam conditions in 2026.
One thing upfront: if any article or calculator you’re using still lists the Step 2 CK passing score as 214, stop reading it. Effective July 1, 2025, the USMLE Management Committee raised the passing standard from 214 to 218 — a four-point increase that applies to every examinee testing on or after that date. That’s the single most important fact in Step 2 CK prep right now, and most competitor articles haven’t caught up.
What NBME Step 2 CK Score Conversion Actually Is
A word of precision here, because most online calculators skip this part entirely.
NBME does not publish an official raw-to-score conversion table. There is no formula buried in their servers that these calculators access. What exists instead are community-derived regression formulas built from thousands of anonymous student reports — people who voluntarily shared both their CCSSA results and their actual Step 2 CK scores, which were then pooled into regression models.
Community-derived formulas approximate the conversion using the pattern: Estimated Score ≈ 299–300 – (1.08–1.10 × wrong answers), with the coefficient varying slightly by form. For example, 50 wrong answers on Form 10 predicts approximately 245.
The form-specific formulas used in our NBME Step 2 CK Score Conversion Calculator are:
- Form 9: 298.45 – 1.09 × wrong answers
- Forms 10–13: approximately 299–300 – 1.08–1.10 × wrong answers (form-specific coefficients)
- Form 14: 299.20 – 1.08 × wrong answers
- Form 15: tracks closely to Form 14, regression data still consolidating
These formulas are calibrated against real student outcomes — not theoretically derived. But they come with an important limitation: your CCSSA likely score represents your estimated USMLE Step 2 CK score ±9 points, per NBME’s own documentation. A score of 247 on an NBME form could reflect anything from 238 to 256 on the real exam. That 18-point window is not a flaw in the calculator — it’s the inherent uncertainty of the instrument.
Below 230, the error is worse. Published academic prediction models show the standard error nearly doubles at lower scores, which means if you’re in borderline territory, your NBME score is an even rougher estimate than most students realize.
Score Context: What 2026 Has Changed
New Passing Standard — And What Most Articles Still Get Wrong
At its June 2025 meeting, the USMLE Management Committee raised the Step 2 CK passing standard from 214 to 218, effective July 1, 2025.
There’s also a practical complication almost nobody is covering: while Examinee Performance Reports and INSIGHTS® are being updated to reflect the new passing standard, examinees may currently receive pass probabilities calculated against the old 214 threshold. If your CCSSA score report predates the system update, the probability you’re reading may not reflect current standards. Check the report generation date.
Why Passing and Competitive Are Two Different Things
With Step 1 now pass/fail, Step 2 CK has taken on far greater weight in residency decisions. The average score for US and Canadian first-time takers sits around 250, placing the passing threshold of 218 at roughly the 3rd percentile.
Passing and competitive are separated by 32 points. A student who clears 218 and a student who scores 250 have both “passed,” but they’re applying to residency from entirely different positions — and that gap is exactly what makes score conversion data useful beyond just checking whether you cleared the threshold.
What Scores Mean by Specialty
The national mean conceals enormous variation. Based on NRMP Charting Outcomes 2024 data:
- Ultra-competitive (Dermatology, Plastics, ENT, Ortho, Neurosurgery): Matched applicant averages around 257. A 250, solidly above average overall, sits below the mean for successful applicants in these fields.
- Competitive (Anesthesia, Radiology, General Surgery, OB/GYN, Emergency Medicine): 252–256 is comfortable territory. 245–249 can work with a strong overall application.
- Standard (Internal Medicine, Pediatrics, Psychiatry, Primary Care): 240–249 puts you in a genuinely competitive position.
- IMGs: The bar is consistently higher for the same specialty compared to US MD seniors. Matched US IMGs averaged 235.6 overall in 2024; matched non-US IMGs averaged 244.8. Step 2 CK is one of the most controllable ways to offset other application disadvantages.
A score of 247 doesn’t mean the same thing across these pools. Know which pool you’re in before NBME conversion data means anything.
Form-by-Form: What Each CCSSA Is Actually Testing
Not all CCSSA forms are created equal, and treating them as interchangeable is one of the most common prep mistakes. Each form has a distinct character — in terms of difficulty calibration, question style, and how well it tracks with the real exam.
Form 9: What It’s Actually Testing
Use our NBME 9 Step 2 CK Score Calculator to convert your raw score.
Form 9 is currently the oldest active form in the pool. The actual Step 2 CK exam has evolved heavily in recent years — toward “Next Best Step in Management,” Quality Improvement, and Patient Safety. Form 9 still leans on outdated diagnostic trivia and obscure pediatric and OB/GYN guidelines the real exam has largely moved past.
The curve is harsher than you’d expect: 54 wrong answers (roughly 73% correct) lands you around 240. For competitive specialties targeting 255+, that’s almost no margin.
It is incredibly common for students to score in the 210s on Form 9 and then jump 15 to 20 points by Forms 10 or 11 a few weeks later. Take Form 9 early, use the subject breakdown to identify your weakest systems, and don’t let the overall number anchor your self-assessment for the rest of prep.
Forms 10 and 11: Mid-Prep Reality Check
NBME 10 Step 2 Score Calculator | NBME 11 Score Calculator
Form 10 has the strongest reputation for clean, logical question construction — the clinical reasoning pathway from vignette to correct answer is the most internally consistent of any active CCSSA form. If Form 9 tested whether you know obscure facts, Form 10 tests whether you think like a clinician.
Form 11 is the first form where Quality Improvement questions begin appearing with any regularity, and where stem vagueness starts to mirror what you’ll actually see on test day. Together, these two forms give you the most honest picture of where your mid-preparation baseline sits. Among Forms 9–12, Form 11 is the most reliable mid-prep indicator — though Forms 14 and 15 remain the definitive predictors closer to exam day.
Forms 12 and 13: Format Transition
NBME 12 Score Calculator | NBME 13 Score Calculator
Form 12 in week 3 before Forms 10/11 may seem counterintuitive — the reason is that Form 12’s unusual question style surfaces content gaps that the more logically constructed Forms 10 and 11 might actually mask.
Form 13 is where modern CCSSA formatting begins in earnest. HPI-chart format questions start appearing, and the overall structure begins tracking meaningfully closer to what you’ll face on real exam day.
Forms 14 and 15: These Are the Ones That Matter
NBME 14 Score Calculator | NBME 15 Score Calculator
These forms use the long HPI-chart vignette format — dense clinical presentations with full patient histories, labs, and vitals — at the highest frequency of any active CCSSA forms. Quality Improvement, PDSA cycles, and root cause analysis appear here with the greatest regularity. Your performance on Forms 14 and 15 reflects your readiness for the real exam in a way that Forms 9–12 simply cannot replicate.
Don’t take these early. Burning Form 14 in week two of a six-week dedicated period wastes your most informative signal at the point when it’s least representative of your final preparation level. Save them for the final two weeks.
Recommended Taking Order
NBME Systematically Underpredicts You — Here’s the Math
This is buried in fine print and should be front and center in every score conversation.
According to NBME’s own documentation, for a student whose CCSSA predicted a score of 246, actual Step 2 CK performance will fall in the range of 233–261 about two-thirds of the time. The lower bound sits only 3 points below the predicted score. The upper bound is 15 points above it.
That asymmetry reflects how Step 2 CK actually works.
Step 2 CK is a clinical reasoning exam, not a recall exam — which means your performance on it is far more sensitive to how you’re sleeping, how you’re thinking, and whether you’ve actually synthesized what you’ve studied versus just memorized it. A student who prepared well but had an off NBME day can easily exceed that score on the real exam; the reverse is structurally less common.
NBMEs are also taken during preparation, not at peak readiness. The real exam catches you after you’ve finished — after final consolidation, after the last week of review. That week matters more than most students account for. And students who walk in trusting their preparation routinely outperform their NBME estimates, while those anchored to a bad Form 9 score from three weeks earlier sometimes underperform — not from lack of ability, but from the wrong mindset going in.
Practical adjustment: Average your last two to three NBME scores taken within two weeks of each other. Add 3–5 points. That’s your working expected range.
A student who takes Form 14 ten days before their exam, scores 243, and concludes they’re “not ready for 250+” is very likely drawing the wrong conclusion. Their NBME is a floor, not a ceiling.
UWSA vs. NBME: Where the Numbers Actually Land
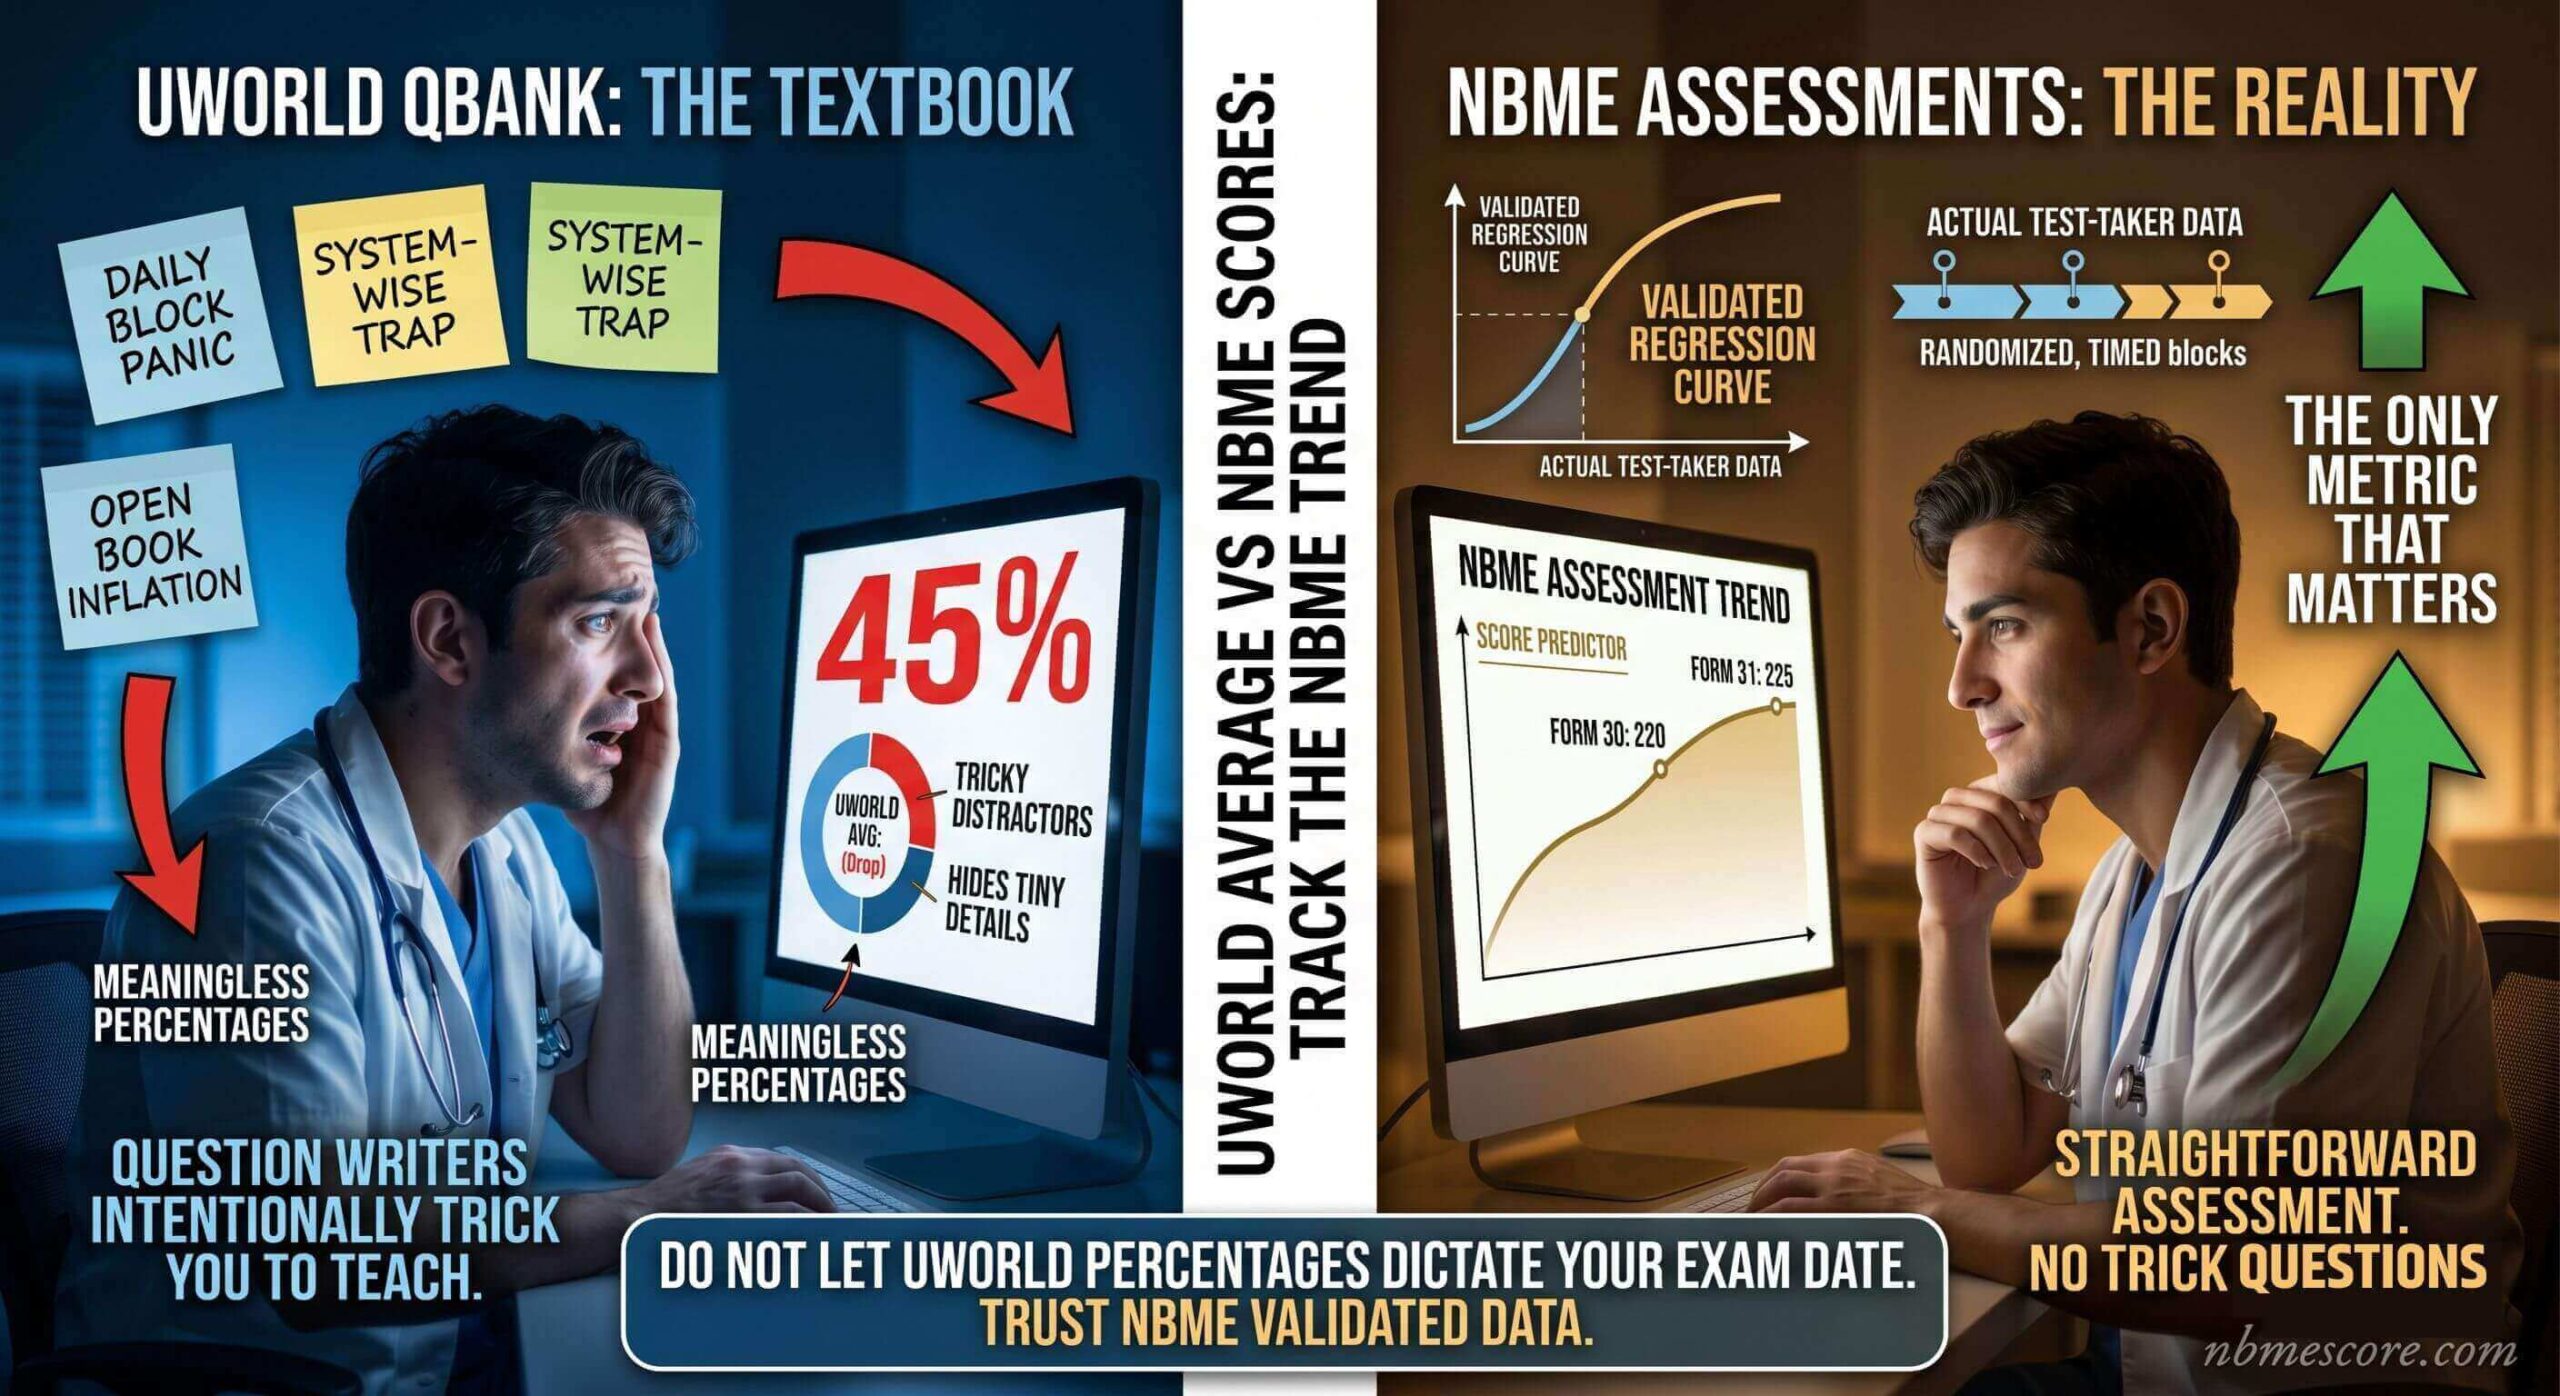
UWorld QBank percentage is not a score predictor. The relationship between UWorld percentage and NBME score is contaminated by too many variables — timed vs. untimed, first pass vs. second pass, subject distribution. UWorld is the best learning tool in the Step 2 ecosystem — just don’t ask it to tell you where you’ll score.
UWSA 1 consistently overpredicts. Across community data, it runs higher than NBME forms taken at the same preparation stage. Use it for stamina practice and mid-preparation confidence calibration — not as a final score predictor. Check your estimate with our UWSA 1 Step 2 Score Conversion tool.
UWSA 2 is a different story. Per tutor-compiled student outcome data, UWSA 2 consistently lands within ±5 to 8 points of real exam scores for most students when taken in the final 7 to 14 days of preparation. It carries a slight optimistic bias of 0–5 points, but it’s the most statistically powerful single assessment available. Use our UWSA 2 Step 2 Score Conversion tool to calculate your estimate.
For scheduling decisions: Use NBME Form 14 or 15 plus UWSA 2 in the final week. Average the two scores — don’t pick the higher one. Weight the more recent score slightly more heavily. Add 3–5 points for underprediction bias.
When UWSA 2 and your latest NBME agree within 5 to 7 points, you have a reliable prediction window. When they diverge by more than 10 points, find the cause before making any scheduling decision — don’t just average them and move on.
Reading Your CCSSA Score Report (Most Students Miss This)
Most guides tell you what score to target. Almost none explain how to read the report your NBME gives you after each CCSSA — and the subject breakdown section is worth more than the headline number.
Your CCSSA score report includes a Total CCSSA Score, a pass probability estimate (valid within one week of taking), and a subject-level breakdown by Physician Task, System, and Discipline. Green circles represent your estimated performance category (EPC); the black line represents the average estimated performance of Step 2 CK first-takers.
If Endocrinology is consistently below that black line across three consecutive forms, that’s not noise — that’s a week of targeted work with a measurable return. If your score is above the line in your three strongest systems and below it in everywhere else, your overall score has a structural ceiling that more UWorld questions won’t move.
The students who use NBME data best aren’t the ones who take the most forms — they’re the ones who read the subject breakdown on every single one.
One critical update: while Examinee Performance Reports are being updated to reflect the new passing standard of 218, examinees may currently receive probabilities based on the previous standard of 214. Check the report generation date; if it predates July 2025, mentally adjust the probability accordingly.
Five Mistakes That Cost Students Points and Time
These are identifiable, specific errors — not generic study tips.
1. Treating Form 9 as a score predictor. Form 9 reflects an older version of Step 2 CK. Take it early, use the subject breakdown to find gaps, and move on. Don’t let a poor Form 9 score set the emotional tone for the rest of your dedicated period.
2. Anchoring to whichever score feels better. UWSA 1 gave you 258. Form 11 gave you 244. When assessments disagree by more than 10 points, the more conservative NBME is almost always closer to your real exam result. Emotional comfort and statistical validity point in different directions here.
3. Ignoring the ±9-point range on your CCSSA report. This one comes up constantly and matters more than students realize. That range is official NBME documentation — not a calculator estimate. A score of 244 with a ±9 range is not the same as knowing your exam score is 244. Build that uncertainty into your planning.
4. Comparing scores across forms without adjusting for difficulty. A 245 on Form 9 and a 245 on Form 14 represent different things. Form 9’s curve is strict relative to its difficulty level. Form 14 tests reasoning in a format that tracks far closer to real exam day. The form context is inseparable from the score.
5. Scheduling decisions based on a single assessment. Three forms over four to six weeks tell you something. One form, taken on one day, tells you almost nothing.
Frequently Asked Questions
Que. Is 218 the new passing score for Step 2 CK?
Yes. Effective July 1, 2025, the passing standard increased from 214 to 218. This applies to all examinees testing on or after that date; exams before July 1, 2025 are scored against the previous standard.
How accurate is NBME Step 2 CK score prediction?
CCSSA forms carry an official uncertainty of ±9 points per NBME’s documentation. For scores above 230, community regression data shows predictions landing within roughly ±8 points of actual exam scores for most students when assessments are taken within two weeks of the exam. Below 230, the error margin grows meaningfully — which is exactly when students most need accurate data.
What is a good NBME score for Step 2 CK in 2026?
“Good” is entirely specialty-dependent, which is why generic cutoffs mislead more than they help. A 240 is broadly competitive for primary care. A 250 is the rough midpoint for competitive specialties. Ultra-competitive fields (Dermatology, Ortho, Plastics, Neurosurgery) have matched applicant averages around 257. Use the specialty benchmarks above to calibrate.
Should I trust UWSA 2 or NBME for Step 2 prediction?
Both, taken together. NBME forms 14 and 15 are the most structurally aligned with real exam content. UWSA 2 has the highest statistical correlation with actual Step 2 CK scores when taken within two weeks of the exam. When both agree within 5–7 points, you have a reliable prediction window.
How many NBME forms should I take for Step 2 CK?
A minimum of three CCSSA forms across your dedicated period. You need at least three data points to identify a trend. More than five forms during a six-week dedicated period starts cutting into time needed for targeted content review — and risks burning your best predictive instruments too early.
My CCSSA predicted 243 but I need 255 for Dermatology. Should I delay?
Not based on that single number. First identify your trend across multiple forms. Check whether your subject-level breakdown shows a consistent gap in specific systems you haven’t yet addressed. Then use the gold standard combination (Form 14/15 + UWSA 2) before making a final call. The CCSSA is structurally more likely to underestimate you than overestimate you.
A Practical Schedule for Using Your Score Data
Weeks 1–2: Take Form 9. Use the subject breakdown exclusively — don’t anchor to the overall score. Identify your bottom two or three systems and allocate extra time there.
Weeks 3–4: Take Forms 10 or 11. Now you have two data points. Look at the trend, not the numbers in isolation. Which systems are still below the national average line?
Weeks 5–6: Take Forms 13, 14, or 15 under full timed conditions. Use our NBME Step 2 CK Score Conversion Calculator to track your score trend across all forms in one place. Your Form 14 or 15 score, plus 3–5 points for underprediction, is your most honest expected number going into exam day.
Final week: UWSA 2 plus Form 15. Average the two scores — do not pick the higher one. That average, adjusted upward by 3–5 points, is your working prediction.
Not sure how to structure your dedicated period around these forms? Our AI Study Plan Generator builds a personalized USMLE schedule based on your target score, exam date, and weak systems.
When to genuinely consider delaying: If your last two late-form NBMEs (Forms 13–15) both sit below your specialty’s competitive threshold, and you can identify specific systems that are bleeding points and haven’t been addressed — two more targeted weeks have a real return. If you’ve been studying for ten weeks, scores have plateaued across multiple forms, and you’re mentally exhausted, more time won’t fix what burnout has cost you. That’s a different problem than preparation.
What Separates Students Who Use This Data Well
Most students open their CCSSA report, look at the three-digit number, and close the tab. That number is useful — but it’s not where the real information lives.
The students who actually improve between forms are the ones who spend ten minutes on the subject breakdown every single time. Not because it tells them what to study in general, but because it tells them where their ceiling currently is. A student who is strong in Cardiology and Pulmonology but consistently below average in Endocrinology and Musculoskeletal doesn’t have a preparation problem — they have a targeting problem. The subject breakdown makes that visible. The overall score just confirms it exists.
With Step 1 now pass/fail, your Step 2 CK score carries more weight in residency decisions than any previous generation of applicants has faced. Use the right forms at the right time, take the subject breakdown seriously on every single one, and let your trend across three or more assessments — not any individual number — tell you where you actually stand.
Data sources: USMLE official passing standard announcement (usmle.org, June 2025); NBME CCSSA official documentation including ±9-point range (nbme.org, July 2025 update); NRMP Charting Outcomes in the Match 2024 — U.S. MD Seniors and IMG editions; community-aggregated student score reports pooled across CCSSA Forms 9–15, 2024–2025 exam cycle; Elite Medical Prep NBME interpretation guide (September 2025); MedBoardTutors Step 2 NBME guide (April 2026).